How Long Does the Stock Market Take to Recover

Illustration of a man in a yellow shirt thoughtfully looking at a rising stock chart arrow, with the text "How long does the stock market take to recover?" displayed prominently on a blue grid background.

Understanding Stock Market Recovery Timelines and What Influences a Rebound Curious about how long the stock market takes to recover after a major downturn? I’ve crunched the numbers on the average recovery time of the S&P 500 and other leading indices to give you data-driven insights you need to navigate corrections, bear markets, and crashes. … Read more


How Variance Drain and Volatility Decay Slowly Destroy Your Portfolio

variance drain feature image

The Hidden Tax on Your Investments: A Deep Dive into Variance Drain and Its Impact on Your Wealth Hello, savvy investors and fellow average Joes alike! If you’ve ever scratched your head wondering why your investment returns seem to fall short of what you’d expect, you’re not alone. Today, we’re cutting through the noise and … Read more

Why Investors Are Choosing Index Funds Over Stock Picking Now A Days

Graphic with bold white and yellow text reading “Forget Stock Picking: Why Smart Investors Are Choosing Index Funds Instead.” A red zigzag line and a rising green bar chart with an upward arrow illustrate the contrast between market volatility and steady index fund growth.

Let’s be real: chasing individual stocks might feel thrilling, but it’s usually a losing game for us, everyday investors. In this post, we’ll break down exactly why stock picking often leads to disappointment and why index funds consistently deliver better results for your hard-earned cash. We’ll back it up with data from top-notch resources like … Read more

Guide to Portfolio Margin: Unlocking More Trading Power

Illustration featuring the words "Portfolio Margin" at the top, a bar chart with an upward-trending arrow, gold coins, dollar bills, and a brown briefcase in the background. Overlaid is a black circle with green money graphics and the text "Get Joe Money Right" in the center.

How Regular Investors Can Safely Leverage Risk-Based Margin for Bigger Gains Portfolio margin can feel like Wall Street’s best-kept secret—promising everyday traders more power, flexibility, and efficiency in their investing strategy. But what exactly is portfolio margin, and how does it differ from the standard “Reg T” margin most of us know? As an average … Read more

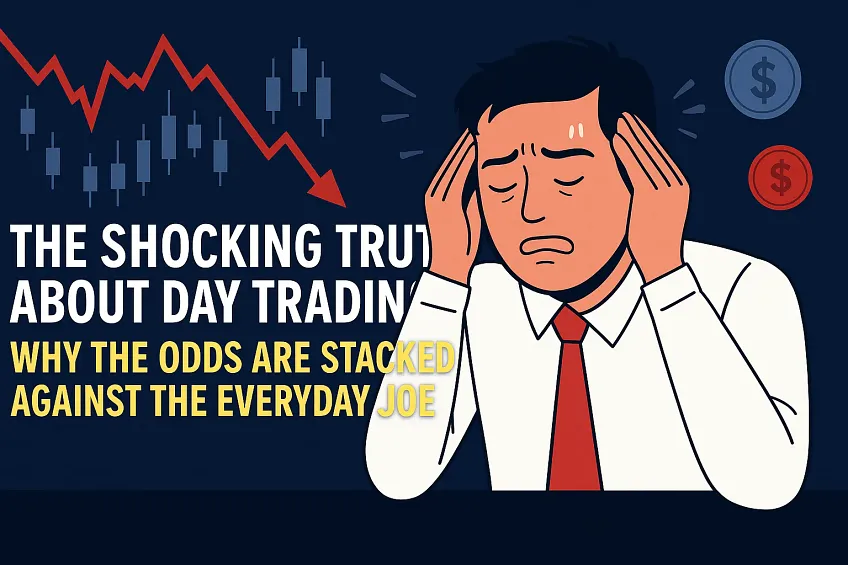
Why Most Day Traders Fail To Make Money

Illustration of a distressed man in a white shirt and red tie holding his head with both hands, as a red downward-trending stock chart and candlestick patterns appear beside him. Bold text reads, “Why Most Day Traders Fail” with a subheading in yellow: “Why the Odds Are Stacked Against the Everyday Joe.” Blue and red dollar coin icons hover in the background.

If you’ve ever thought about trading stocks all day, hoping to beat the market and become your own boss, you’re not alone. But here’s the cold, hard truth: the odds are overwhelmingly against you. Today, we’re peeling back the curtain on day trading and showing you why most day traders fail to make money—and how … Read more

Get Joe Money Right
Privacy Overview

This website uses cookies so that we can provide you with the best user experience possible. Cookie information is stored in your browser and performs functions such as recognising you when you return to our website and helping our team to understand which sections of the website you find most interesting and useful.