Understanding Stock Market Recovery Timelines and What Influences a Rebound
Curious about how long the stock market takes to recover after a major downturn? I’ve crunched the numbers on the average recovery time of the S&P 500 and other leading indices to give you data-driven insights you need to navigate corrections, bear markets, and crashes. You’ll uncover real-world recovery timelines—from the 25-year climb back after the Great Depression to the record-fast rebound in 2020—and learn the key factors that drive market recoveries. By the end, you’ll have a clear roadmap for what to expect when stocks dip, plus simple strategies that help everyday investors like you buy the dip with confidence and stay invested for the long haul.
Corrections, Bear Markets & Crashes: What’s the Difference?
Before we dive into the data, let’s nail down our definitions:
- Correction (10–20% drop):
- Frequency: Roughly once every 2–3 years.
- Average Depth: ~13–14% pullback.
- Typical Recovery: About 8 months to new highs, according to CFRA data (Advisor Perspectives).
- Bear Market (≥20% drop):
- Frequency: ~12 since WWII.
- Average Drop: ~33% peak to trough.
- Typical Recovery: ~2 years to reclaim old peaks in price-only terms (Advisor Perspectives).
- Crash (≥30% drop, often sudden):
- Rarity: Only six S&P 500 crashes of this magnitude since 1950.
- Recovery Range: From 2 years (1987) up to 25 years (1929–1954).
Why it matters: The bigger the drop, the more time it takes to get back, but not always in direct proportion—policy response, valuations, and external factors can dramatically speed up or slow down the rebound.
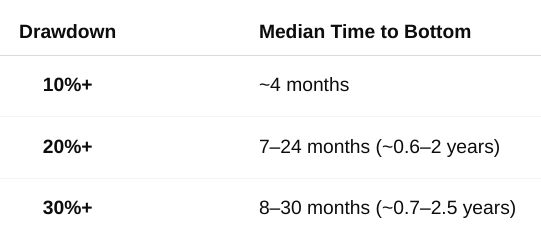
How Quickly Do Markets Fall? Time to the Bottom
Imagine I zip you back to any peak between 1920 and today, and you know a drop of at least X% is coming—how fast does the market typically reach its trough?

Known decline vs. unknown:
- Known ahead of time (controlling for magnitude) → markets typically hit their low in under 2 years, even for deep plunges.
- Random all-time high (not knowing the drop is coming) → the wait for a 20%+ bear can be 5–6 years, because large slumps are historically rare.
But right now, you’re already in the dip. So what matters most is how quickly you can get back to even—let’s tackle that next.
Case Studies: Recovery Clocks from 1929 to 2020
Below are five landmark downturns with their peak-to-peak recovery times, shown in nominal price and real total return (dividends reinvested, inflation-adjusted).
Great Depression: 25 Years vs. 7 Years Real
- Decline: ~–86% (Sept 1929–July 1932)
- Nominal Recovery: 25 years (Dow reclaimed 1929 highs in Nov 1954)
- Real Recovery: ~7 years to break even in inflation-adjusted, dividend-reinvested terms, thanks to deflation and double-digit yields in the early ’30s (MarketWatch).
Lesson: Without dividends and ignoring inflation, deep crashes can leave portfolios underwater for decades. But real, dividend-inclusive returns can shorten the pain dramatically.
1973–74 Stagflation: A Real-Powerhouse Slowdown
- Decline: ~–48% (Jan 1973–Oct 1974)
- Nominal Recovery: ~7–8 years (S&P finally broke Jan 1973 highs in late 1980)
- Real Recovery: Over 20 years to restore purchasing power, as consumer prices more than doubled during the 1970s (Investopedia).
Lesson: High inflation drags out real recovery far beyond nominal price rebounds. Even after markets top out, your dollar doesn’t buy as much until inflation cools.
Dot-Com Bust: When Tech Stayed Down for 15 Years
- Decline: –49% for S&P 500 (Mar 2000–Oct 2002); –78% for Nasdaq
- Nominal S&P Recovery: 7.5 years (Mar 2000 → Oct 2007)
- Nominal Nasdaq Recovery: 15 years (Mar 2000 → Apr 2015)
- Real S&P Recovery: ~14 years (accounting for ~35% inflation and dividends) (Macrotrends).
Lesson: When valuations start sky-high (CAPE ~44 in 2000), markets need years of earnings growth just to justify prior prices. Tech-heavy indexes lag hardest.
2008 Financial Crisis: 5–6 Years to Get Back Even
- Decline: –57% (Oct 2007–Mar 2009)
- Nominal Recovery: 5.5 years (Oct 2007 → Apr 2013)
- Real Recovery: ~6 years (low inflation, dividends reinvested) (FRED).
Lesson: Massive Fed easing (zero rates, QE) and fiscal stimulus can cut recovery times in half compared to past structural crises.
COVID-19 Crash: The Fastest Recovery Ever
- Decline: –34% (Feb 2020–Mar 2020)
- Nominal Recovery: 6 months (Feb 19 → Aug 18, 2020)
- Real Recovery: 6 months (minimal inflation and dividend drag) (Yahoo Finance).
Lesson: An event-driven shock with strong policy support and healthy pre-crash fundamentals can trigger a V-shaped recovery faster than ever.
Average Recovery Times by Drawdown Severity

Bottom line: Stocks fall fast but rise slow. Even a 30% plunge can take 4–7 years to get back to new highs, depending on the era and economic backdrop.
Why Some Downturns Bounce Back Faster
- Monetary Policy
Fast, aggressive rate cuts and quantitative easing (2009, 2020) can supercharge recoveries. Delayed or tight policy (1930s, 1970s) drags them out. - Fiscal Support & Economic Health
Big stimulus checks and strong growth fuel rebounds. Prolonged recessions and underinvestment stretch recoveries. - Inflation & Interest Rates
High inflation forces higher nominal peaks before you regain real purchasing power. Low, stable prices make rebounds smoother. - Investor Psychology
Fear can keep money on the sidelines for years (Great Depression). Optimism—often fueled by policy and valuation arguments—draws it back quickly. - Starting Valuations
Overheated peaks (2000) → long waits for earnings to catch up. Deeply beaten-down troughs (1982, 2009) → bargain hunters rush in. - Catalyst Type
- Event-driven (pandemics, one-off shocks) → often quick V-shapes.
- Structural (bubbles, credit crises) → systemic damage that takes years to repair.
What the Average Investor Can Do Today
- Keep Perspective
Every historical downturn has ended in a new high—sometimes fast, sometimes slow, but always eventually. - Stay Invested
Time in the market beats timing the market. Quitting at the bottom risks missing the fastest, most powerful rebounds. - Diversify
Blend equities with bonds, dividend-payers, and alternatives to smooth the ride and lock in some returns even when stocks wobble. - Dollar-Cost Average
Automate contributions—buy more when prices fall, less when they rise. It’s the easiest way to “buy the dip” without sweating it. - Maintain a Cash Cushion
Having 6–12 months of expenses in cash or ultra-short bonds prevents forced selling at the worst possible time. - Focus on Fundamentals
When valuations are attractive and policy support is strong, downturns often breed long-term opportunities.
Personal note: I’ve felt my heart drop in late 2008 and again in March 2020—only to see those lows turn into some of the best buying opportunities of my life. By treating downturns as discount windows, I stress-tested my plan and came out stronger.
Looking for a diversified portfolio? Check out Ray Dalio’s All Weather Portfolio.
Key Takeaways for Everyday Investors
- Quick dips vs. slow climbs: Markets often bottom within months to a couple years, but recoveries—especially for deep bear markets—can take 4–7 years or longer in nominal terms.
- Real vs. nominal: Inflation and dividends can cut or extend your real break-even point dramatically.
- Policy matters: Aggressive Fed and government support can speed healing.
- Psychology rules: Fear prolongs slumps; optimism (and momentum) accelerates rebounds.
- Your playbook: Stay diversified, automate your buying, keep a cash buffer, and remember that nothing lasts forever—not bull markets, not bear markets, and certainly not this downturn.
When the headlines roar, trust the data: downturns always end, recoveries always happen, and time in the market remains your greatest ally. As an Average Joe, I know it’s hard to see past the red numbers—but history is clear: markets don’t just go back up—they reward those who stay patient.
Disclaimer: This post is for educational purposes only and is not financial, legal, or tax advice. Do your own research or consult a qualified professional before making any decisions.
Affiliate Disclosure: GetJoeMoneyRight.com is a participant in the Amazon Services LLC Associates Program, an affiliate advertising program designed to provide a means for sites to earn advertising fees by advertising and linking to Amazon.com and affiliated sites.

